
Jitish Kallat: Wind Study (Hilbert Curve)
On this page
Share
Our planet is constantly moving, yet most of that motion is invisible. Jitish Kallat’s Wind Study (Hilbert Curve), presented as an interactive experience on Google Arts & Culture, invites us to literally draw with the world’s wind—turning meteorological flows and mathematical structures into felt, visual time.
- Table of Contents
What is Wind Study (Hilbert Curve)?
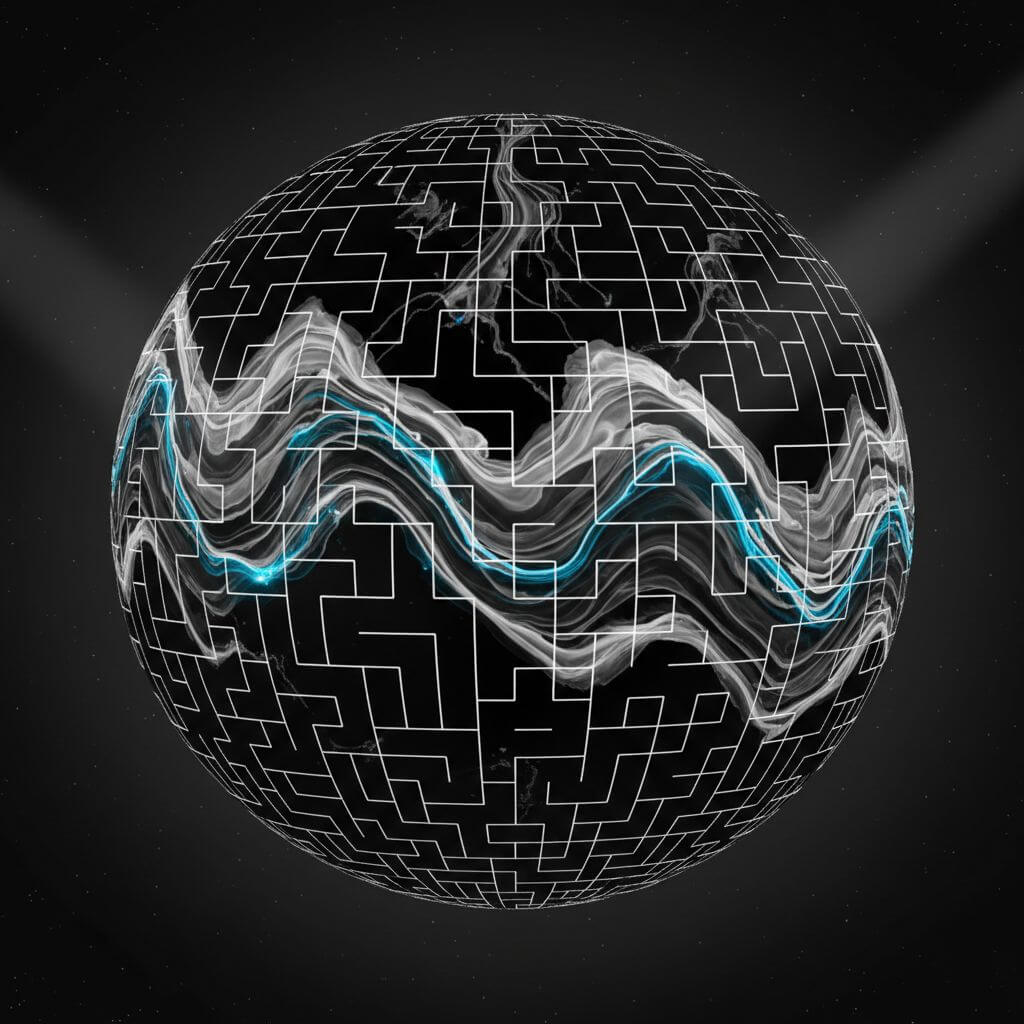
Wind Study (Hilbert Curve) is a participatory artwork by Indian artist Jitish Kallat that transforms live or recorded wind data into intricate line drawings. Presented on Google Arts & Culture, it blends planetary-scale phenomena with a space-filling mathematical curve. The result is a meditative interface where viewers witness wind becoming mark, rhythm, and memory.
Core idea
- Use atmospheric motion as a drawing instrument.
- Channel that motion along a Hilbert curve to reveal structure across scales.
- Invite viewers to experience climate not as a distant abstraction, but as a dynamic field we inhabit.
How the experience works
While the interface varies by exhibit or device, the underlying logic is consistent: wind data drive visual strokes.
Interaction loop
- Select a geography or global view.
- Sample wind vectors (direction, magnitude) at chosen time.
- Traverse a Hilbert curve laid over the canvas grid.
- Modulate stroke direction and weight by the local wind vector.
- Accumulate lines into a dense, woven drawing that encodes atmospheric flow.
What you perceive
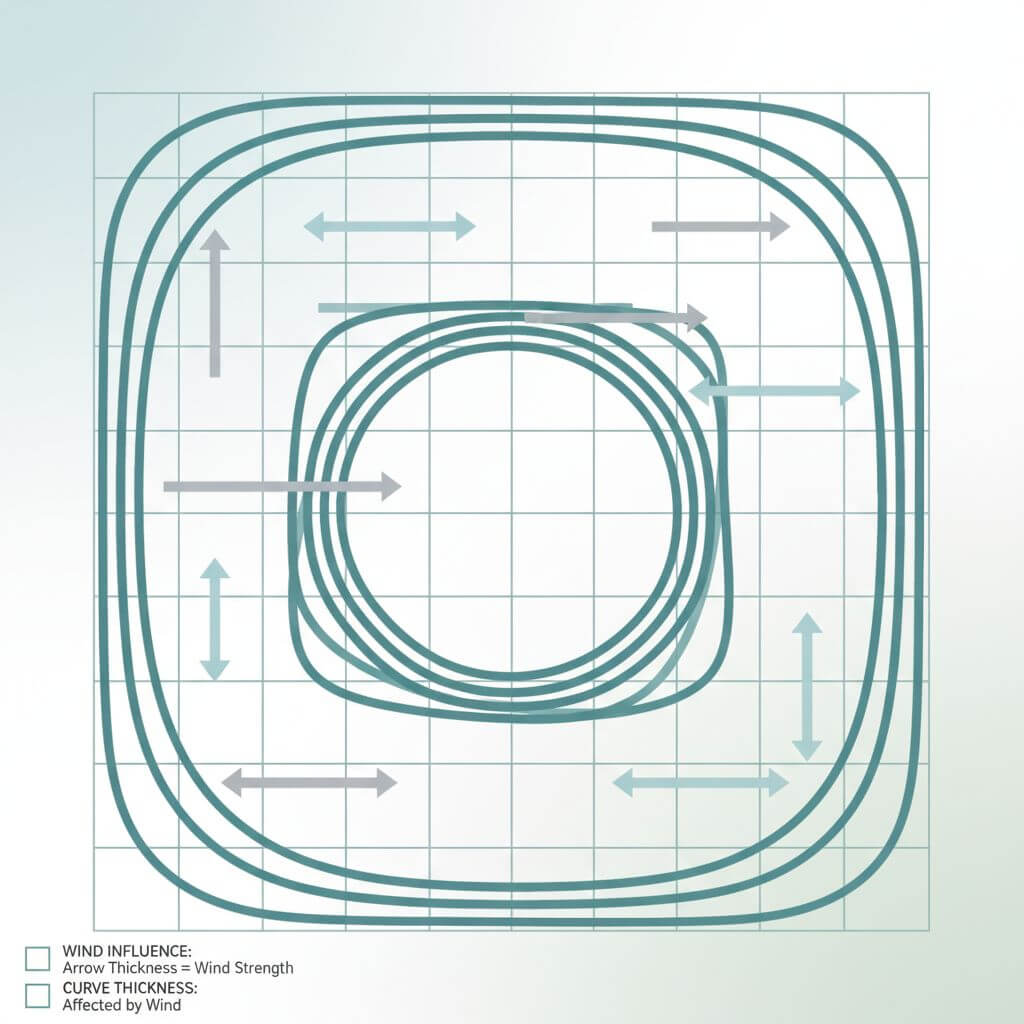
- Directionality: subtle rotational biases become clear as strokes align.
- Intensity: gusts and calms emerge through line weight and density.
- Temporality: the image builds over time, turning transient motion into enduring trace.
Why a Hilbert curve? Making wind legible
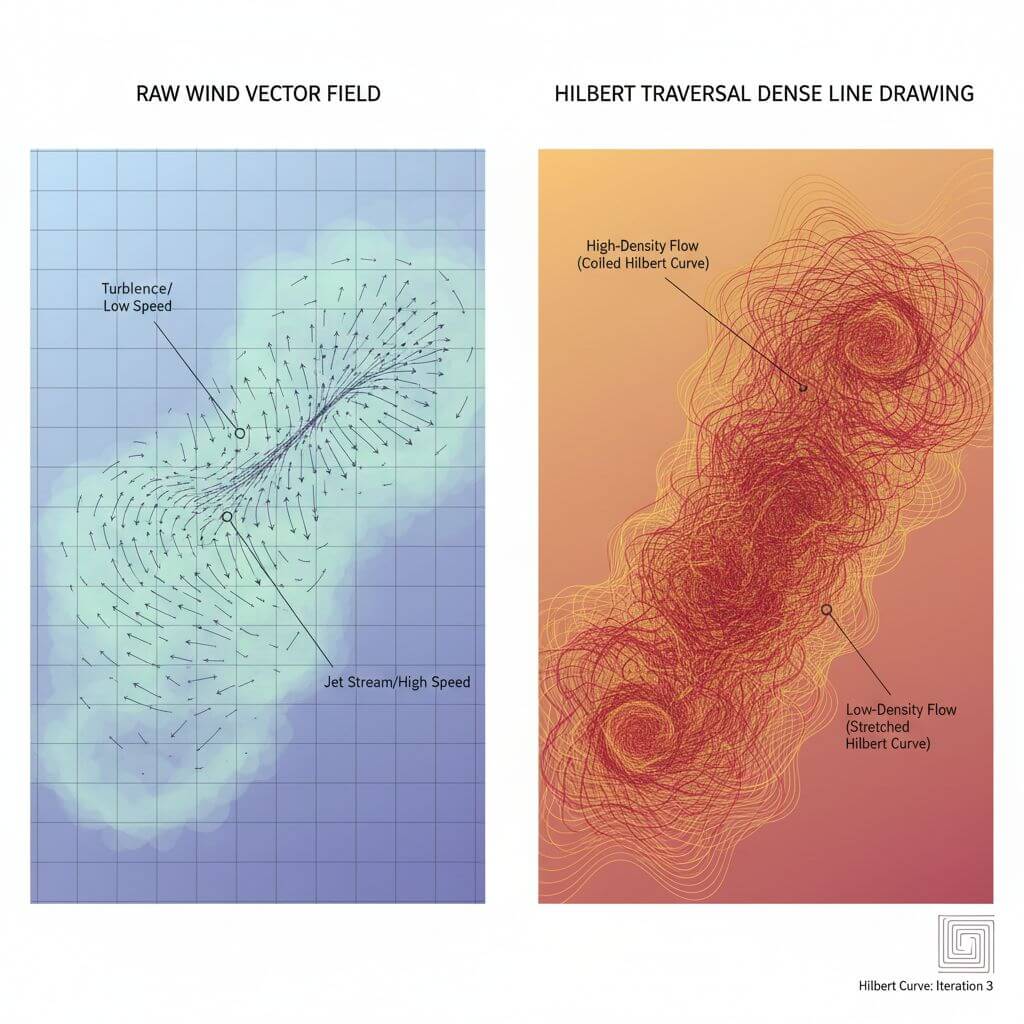
The Hilbert curve is a space-filling, recursive path that visits every cell in a grid while preserving locality—nearby points in 2D remain near in the 1D traversal order. This makes it ideal for translating complex fields like wind into continuous drawings.
Benefits of a Hilbert traversal
- Local continuity: nearby wind vectors produce smoothly evolving strokes.
- Multiscale readability: recursive structure lets viewers sense patterns from micro eddies to macro flows.
- Efficient coverage: the curve visits each cell once, balancing completeness with visual rhythm.
From data to drawing: a plausible pipeline
We don’t need the exhibition’s source code to understand the key computational ideas. Below is a high-level pipeline common to wind-field visualizations used in generative art:
1) Data acquisition
- Source: public meteorological grids (e.g., u/v wind components). Time-indexed, geo-referenced.
- Preprocess: interpolate to the display’s resolution; normalize magnitudes.
2) Field mapping
- Establish a mapping from geo-coordinates to canvas cells.
- For each cell, compute wind vector (direction θ, speed |v|).
3) Hilbert traversal
- Generate an order-N Hilbert curve matching the grid size (e.g., 512×512).
- Iterate cells in Hilbert order H(i) for i=1..N².
4) Stroke synthesis
- Pen direction: bias toward θ with controlled noise for organic variation.
- Pen weight: f(|v|), e.g., linear or sigmoid to emphasize mid-range winds.
- Ink accumulation: blend modes to avoid over-saturation; cap max density.
5) Temporal composition
- Single snapshot: render one time slice into a static drawing.
- Time-as-layer: accumulate successive slices for a palimpsest of changing winds.
6) Aesthetic calibration
- Palette: monochrome for legibility, or duotone mapping magnitude→hue.
- Rhythm: tune traversal speed, jitter, and pen pressure for a balanced tapestry.
Artistic context: making the invisible visible
Kallat’s practice often explores planetary rhythms, time, and communication. By letting wind inscribe itself, Wind Study (Hilbert Curve) reveals a shared atmospheric commons. Mathematics doesn’t dominate the art; it offers a scaffold that lets natural variability speak. The drawing is not a diagram but a lived imprint of climate forces—poetic, precise, and open to contemplation.
Why it resonates now
- Climate attention: transforming data into empathy-rich visuals can deepen public understanding.
- Post-screen tactility: line-based renderings echo sketchbooks and prints, bridging digital and analog sensibilities.
- Collective authorship: viewers feel the wind “co-authoring” the work in real time.
How to engage: practical tips
- Change scale intentionally: toggle between regional and global contexts to sense pattern cascades.
- Watch for thresholds: see how small speed changes shift line density and texture.
- Compare times: morning vs evening, monsoon vs dry season, equator vs mid-latitudes.
- Slow down: the work rewards lingering—let your eye trace the curve’s recursion.
Creative AI, data art, and public understanding
Although not a text-to-image generator, the piece sits comfortably within creative AI: it uses computational procedures, data transformation, and rule-based drawing to generate novel visuals.
Broader implications
- Data humanization: rigorous data can be translated into affect, without losing integrity.
- Math as medium: algorithms like Hilbert curves are not merely tools; they are aesthetic agents.
- Education: a gateway to discuss vector fields, recursion, and climate dynamics in classrooms.
FAQ
What is a Hilbert curve in plain terms?
A Hilbert curve is a path that winds through a square grid and visits every cell exactly once. Its recursive design keeps nearby cells close along the path, aiding smooth visual transitions.
Where does the wind data come from?
Interactive wind artworks commonly use public meteorological datasets (e.g., reanalysis or forecast grids). Consult the exhibit notes in Google Arts & Culture for the specific source and timestamp used.
Is this “AI art” or “data visualization”?
It’s both-and. The piece uses computational rules and data to generate imagery (akin to creative AI), while also conveying real-world phenomena (akin to visualization). Its primary aim is experiential understanding rather than analytic measurement.
Can I recreate something similar at home?
Yes. With openly available wind grids and a Hilbert-curve library, you can prototype in Python or JavaScript. Start small (e.g., 128×128 grid), then iterate on stroke synthesis and tone mapping.
Why lines instead of arrows or particles?
Lines accumulate memory: each stroke extends the field’s story across space. Unlike arrows, which explain, lines let you feel—ideal for an artwork foregrounding presence over instruction.
Conclusion
Wind Study (Hilbert Curve) invites us to draw with the world’s breath—where mathematics becomes a listening device and climate becomes line. By coupling a space-filling path with living atmospheric data, Kallat’s work turns the intangible into a textured presence you can watch unfold.
Related resources
- Glossary to explore next: space-filling curves, vector fields, recursion (for internal linking)
- If you need to convert images to sketches or restore sketches into photoreal images for your own experiments, try Sketch To (https://www.sketchto.com/).
Transform Your Images with AI
Turn sketches into stunning images, remove backgrounds, swap faces, and more — all powered by AI.
Try Sketch To FreeShare
Sketch To
Tech writer covering AI tools, image processing, and creative workflows.
Related Articles

The new ChatGPT Images is here
OpenAI rolls out the new ChatGPT Images and GPT Image 1.5: faster generation, precise edits, better text rendering, and a new creation space.

Text to Image vs Sketch to Image: Krea 2 Lessons
Compare text to image vs sketch to image after Krea 2, and learn when prompts, sketches, or both fit concept art and design work.

Knitted Doll AI Prompt: 7 Templates That Work
Use this knitted doll AI prompt guide to turn photos or sketches into cozy yarn dolls. Includes 7 templates, material words, and fixes.